Scientific Calculator vs Graphing Calculator: Key Differences Explained
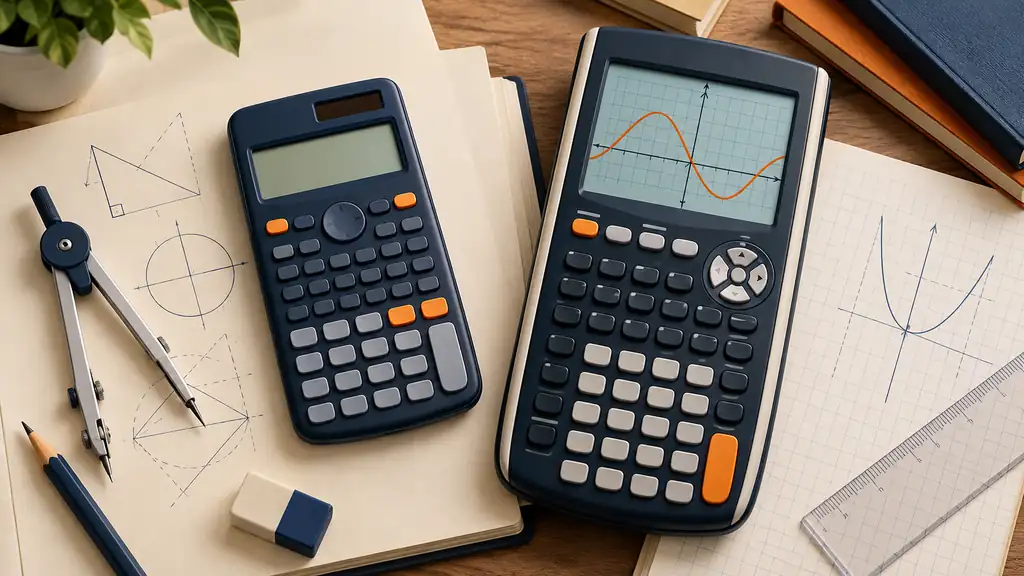
A scientific calculator and a graphing calculator can both handle substantial mathematical work, but the most reliable practical difference between the categories is straightforward: a graphing calculator is designed to plot mathematical relationships on its own display, while a conventional scientific calculator generally is not. That graphical environment changes how you can explore functions, compare curves, and investigate features such as zeros, extrema, and intersections.
Beyond that distinction, the category names tell you less than many buyers expect. Scientific calculators can include function tables, statistics, equation solving, matrices, and even numerical calculus on some models. Graphing calculators also vary widely: some are programmable, some support Python, some provide 3D graphing, and some include a Computer Algebra System (CAS) for symbolic mathematics. Those capabilities need to be checked model by model.
Quick Answer
A scientific calculator fits work that requires functions such as fractions, powers, roots, logarithms, trigonometry, and numerical calculations without requiring graphs to be drawn on the calculator itself. Depending on the model, it may also provide statistics, function tables, equation tools, matrices, or numerical calculus.
A graphing calculator becomes relevant when the work requires you to plot functions on the device, inspect how graphs change, trace curves, or use graphical analysis to investigate features such as roots and intersections. More advanced features such as programming, Python, numerical calculus, 3D graphing, and CAS depend on the exact model rather than following automatically from the word “graphing.”
Scientific Calculator vs Graphing Calculator: Comparison Table
| Feature | Scientific Calculator | Graphing Calculator |
|---|---|---|
| On-device graphing | Generally does not plot mathematical graphs on its display | Designed to plot mathematical graphs on its display |
| Fractions, powers, roots, logs, and trigonometry | Core capabilities on typical scientific models | Common capabilities on graphing models |
| Function tables | Available on some models without graph display | Common on many models alongside graphing |
| Graph analysis | No on-screen graph to trace or analyze | Capabilities such as trace, zeros, extrema, and intersections depend on the model |
| Statistics | Can be substantial; exact tools depend on the model | Can include statistical calculations and graphical data analysis; exact tools depend on the model |
| Matrices and equation solving | Available on some models | Available on many models, but exact capabilities vary |
| Numerical calculus | Available on some advanced scientific models | Available on many models; exact tools vary |
| Programming | Model-dependent | Model-dependent; not guaranteed by the category |
| Python | Not a defining category feature | Supported by some models, not all |
| General CAS | Not implied by the category | Available on some graphing models, but not all |
| Typical reason to use the category | Mathematical calculations without required on-device plots | Plotting and investigating mathematical relationships directly on the calculator |
The Defining Difference Is On-Device Graphing
The most useful dividing line between the categories is not statistics, calculus, programming, or even screen size. It is whether the calculator is designed to draw mathematical graphs on its own display.
Suppose you are working with the function f(x) = x2 − 4. A scientific calculator can evaluate the function at selected values of x. Depending on the model, it may also generate a table of values automatically.
A graphing calculator adds another representation. It can plot the parabola, letting you inspect its shape and see how its zeros, turning point, and other features relate to one another.
That does not make the underlying arithmetic fundamentally different. The graph adds a visual representation and, depending on the model, tools for analyzing that representation.
A Function Table Does Not Make a Calculator a Graphing Calculator
Function tables are a useful example of why calculator categories should not be defined by one secondary feature.
Suppose a calculator evaluates f(x) = x2 − 4 for several inputs:
| x | f(x) = x2 − 4 |
|---|---|
| −2 | 0 |
| −1 | −3 |
| 0 | −4 |
| 1 | −3 |
| 2 | 0 |
From the table, you can identify patterns and see that the function has zeros at −2 and 2. A graphing calculator can take the additional step of plotting the parabola and showing those features within the curve.
Some scientific calculators can generate function tables while still providing no on-device graph display. A table feature alone therefore does not turn a scientific calculator into a graphing calculator.
What Changes When You Can See the Graph?
Consider two phone plans with different fixed monthly charges and different charges based on usage. With a scientific calculator, you can enter several usage levels and compare the resulting totals numerically. A function table may make that process more systematic on models that provide one.
With a graphing calculator, you can plot both cost functions on the same coordinate system. Their intersection shows where the two pricing models produce the same total, while the regions on either side show how their relationship changes as usage changes.
The same principle applies to a quadratic. A table provides selected input-output pairs. A graph shows those values as part of a continuous visual shape, making the turning point, symmetry, intercepts, and overall behavior easier to examine together.
The graph is therefore another mathematical representation, not a replacement for calculation.
Graphing Adds a Viewing Window to the Workflow
A graphing calculator introduces something that ordinary scientific-calculator work generally does not require: a viewing window.
A function can exist perfectly well even when its important features are outside the portion of the coordinate plane currently shown on the display. If the horizontal or vertical range is poorly chosen, a curve may appear misleading, important intersections may be hidden, or the graph may seem to be missing entirely.
Using a graphing calculator therefore involves more than entering an expression and pressing a graph command. Depending on the model and problem, you may need to adjust the viewing window, use an automatic zoom function, trace the graph, or apply dedicated analysis tools.
This is one reason graphing introduces its own workflow rather than simply adding a larger screen to a scientific calculator.
Graph Pixels and Calculated Results Are Not the Same Thing
Suppose two curves appear to cross near x = 1.4. Reading that position visually from the screen gives you an estimate based on the displayed graph.
Many graphing calculators also provide analysis tools that can calculate a numerical intersection. That result is different from estimating the coordinate by looking at pixels.
A symbolic solution is another category again. A calculator with a general Computer Algebra System may be able to manipulate the equations and return an exact symbolic solution in supported cases.
These should therefore remain separate:
- Visual graph estimate: reading a location from the plotted curves.
- Calculated numerical result: using an analysis or solving tool to obtain a numerical value.
- Exact or symbolic result: preserving exact mathematical form or using symbolic manipulation where supported.
A graphing display by itself guarantees neither exact results nor symbolic algebra.
Graphing, Programming, and CAS Are Three Different Capabilities
Three terms are often grouped together even though they describe different capabilities.
Graphing means that the calculator can plot supported mathematical relationships on its display.
Programming means that the calculator provides some environment in which the user can create or run programs. The language and capabilities vary by model. A programmable calculator does not automatically support Python, and a calculator that supports Python does not necessarily provide the same Python environment found on a computer.
CAS, or Computer Algebra System, refers to symbolic mathematical capabilities such as manipulating algebraic expressions and, on supported systems, performing operations such as symbolic differentiation or integration.
A calculator can therefore be graphing but non-CAS. It can be programmable without providing general symbolic algebra. It can also support calculator-side Python without becoming a CAS calculator.
When a course specifies one of these capabilities, verify that capability directly rather than treating the word “graphing” as shorthand for all three.
A Large or High-Resolution Screen Does Not Define a Graphing Calculator
Modern scientific calculators can use multi-line displays, textbook-style mathematical notation, menus, function tables, and relatively detailed interfaces. None of those characteristics alone makes the device a graphing calculator.
The category distinction depends on whether the calculator provides an environment for actually plotting mathematical graphs on the device.
This also means that screen size should not be used as a shortcut. A scientific calculator can have a display capable of showing fractions, radicals, matrices, tables, or multiple lines of information without providing a coordinate plane for plotting functions.
Scientific Calculators Can Still Be Quite Advanced
The word “scientific” should not be interpreted as meaning that the calculator handles only basic arithmetic plus sine and cosine.
Depending on the model, scientific calculators may provide combinations of complex-number calculations, statistics, distributions, regression, equation solving, systems of equations, matrices, vectors, numerical derivatives, numerical integrals, function tables, and other mathematical tools.
This matters when deciding whether graphing hardware is actually necessary. If a course requires numerical calculations, matrices, statistics, or even certain numerical calculus operations but never requires on-device plots, an appropriately equipped scientific calculator may already provide the required functions.
The exact model remains important because no single feature list describes every scientific calculator.
Graphing Calculators Also Differ Substantially From One Another
The graphing category is equally broad. A monochrome graphing calculator and a modern color model may have very different displays and interfaces while belonging to the same general category.
Some graphing calculators provide calculator-side Python. Others use their own programming languages. Some include dedicated 3D graphing environments, while others concentrate on two-dimensional graphing. Some provide general CAS, while many widely used graphing calculators are explicitly non-CAS.
Even basic workflows can differ. One model may organize mathematics around applications, another around traditional menus and function keys, and another around documents or linked mathematical representations.
Buying “a graphing calculator” therefore does not settle questions about programming, CAS, 3D capability, numerical calculus, statistics, storage, or interface design.
Statistics Does Not Automatically Require a Graphing Calculator
Statistics is another area where the category name can be misleading.
Some scientific calculators provide data entry, one-variable and two-variable statistics, regression, distributions, and other statistical calculations. If the assignment requires numerical statistical analysis rather than graphical visualization, those capabilities may be sufficient.
A graphing calculator becomes more relevant when the workflow calls for graphical data analysis on the device, such as displaying scatterplots or examining fitted relationships visually.
The subject name alone therefore does not determine the calculator category. “Statistics” can describe anything from calculating a mean to analyzing a plotted data set, and those tasks place different demands on the calculator.
Calculus Can Mean Graphical, Numerical, or Symbolic Work
Saying that a calculator is “good for calculus” is not precise enough because calculus work can involve several different capabilities.
Graphical calculus can involve examining a curve to understand increasing and decreasing behavior, extrema, intersections, accumulated area, or other visual relationships.
Numerical calculus involves obtaining numerical values for operations such as a derivative at a specified point or a definite integral over given bounds. Some advanced scientific calculators provide numerical calculus without providing graphing.
Symbolic calculus involves manipulating mathematical expressions themselves, such as returning the derivative of x3 + 2x as 3x2 + 2. That generally requires appropriate symbolic or CAS capability.
A graphing calculator is not automatically a CAS calculator, and a scientific calculator is not automatically incapable of numerical calculus. The exact operation matters more than the broad subject label.
Representative Examples of the Two Categories
A model such as the TI-30XIIS illustrates the conventional scientific-calculator category. Its design centers on numerical calculations rather than plotting mathematical graphs on the device.
Models such as the TI-84 Plus CE, Casio fx-CG50, and NumWorks illustrate the graphing category because they provide environments for plotting mathematical relationships on their displays.
Those graphing calculators should not be treated as interchangeable. Their interfaces, programming environments, graphing capabilities, power systems, memory specifications, and other features differ. The examples establish the category distinction, not a common specification sheet.
The same caution applies within the scientific category. One scientific calculator may provide function tables, matrices, or numerical calculus that another model does not.
Which Category Fits the Work?
A useful way to decide is to begin with the mathematical task rather than the calculator label.
- If the work consists mainly of numerical calculations, fractions, powers, logarithms, and trigonometry, a scientific calculator with the required functions may be sufficient.
- If you need function tables but not on-device plots, check advanced scientific calculators before assuming that a graphing model is necessary.
- If you need to plot functions and investigate them directly on the calculator, a graphing calculator provides the relevant graphical environment.
- If you need numerical derivatives or definite integrals, check the exact model rather than relying on the scientific or graphing label.
- If you need symbolic algebra or symbolic calculus, verify CAS capability specifically. Do not assume that every graphing calculator provides it.
- If you need programming or Python, verify the exact programming environment and model. Graphing capability alone does not guarantee either.
A Separate Graphing Tool Can Change the Decision
For homework or unrestricted study, on-device graphing is not always the only way to visualize a function. A scientific calculator can be used for calculations while permitted computer, tablet, or web-based graphing software handles visualization.
That arrangement can cover many mathematical workflows without requiring the same device to perform both jobs.
It is not equivalent in every setting, however. A course may specifically teach a handheld graphing calculator, require one for classroom activities, or prohibit external software during an assessment. A graphing application available during homework may also be unavailable under exam conditions.
The relevant question is therefore not only whether another tool can draw the graph, but whether that tool is permitted and practical in the setting where the mathematics will be done.
Course Requirements Matter More Than the Category Name
If an instructor specifies a calculator model or a particular set of capabilities, follow those requirements before making a category-level decision.
A course may rely on specific graph-analysis commands, statistical workflows, programming languages, or menu instructions. Even two calculators from the graphing category may handle the same task differently enough that classroom instructions do not transfer directly.
Likewise, a course that allows scientific calculators may still impose restrictions on programming, symbolic algebra, stored information, or particular models.
The syllabus and instructor requirements therefore provide more useful guidance than assuming that every calculator within a broad category is interchangeable.
Exam Rules Require a Current Check
Calculator capability and exam eligibility are separate questions. A calculator may be mathematically capable of handling an assessment while still being prohibited by that assessment’s rules.
Do not assume that “scientific calculator allowed” means every scientific calculator is permitted, or that “graphing calculator allowed” means every graphing model is acceptable. Programming, CAS, communication features, stored information, and specific model restrictions can all matter depending on the assessment.
Check the current calculator policy published by the administrator of the exact exam you plan to take. If a course imposes additional restrictions, follow those as well.
Frequently Asked Questions
What is the main difference between a scientific calculator and a graphing calculator?
The most reliable practical distinction is on-device graphing. A conventional scientific calculator performs mathematical calculations without plotting functions on its display, while a graphing calculator provides an environment for drawing and investigating mathematical graphs.
Can a scientific calculator make a function table?
Some can. A scientific calculator may generate values of a function across a range of inputs without drawing the corresponding graph. A function table therefore does not by itself make a calculator a graphing calculator.
Can a scientific calculator handle calculus?
Some scientific calculators provide numerical derivative and integral tools. That is different from plotting calculus-related graphs or performing symbolic calculus. Check the exact model and the specific calculus operations you need.
Can a graphing calculator do everything a scientific calculator does?
Graphing calculators generally provide common scientific functions such as powers, roots, logarithms, and trigonometry, but exact commands, statistics tools, notation, interfaces, and specialized features vary. Compare the actual models when a particular function or workflow matters.
Do I need a graphing calculator for algebra?
Not necessarily. Many algebra calculations can be completed with an appropriate scientific calculator. A graphing calculator becomes relevant when the course requires on-device plots, graphical investigation, or calculator-specific graphing activities.
Is every graphing calculator programmable?
No. Programming capability depends on the exact model. Even among programmable graphing calculators, the available languages and programming environments can differ substantially.
Do all graphing calculators support Python?
No. Some models provide calculator-side Python or MicroPython environments, while others use different programming languages or do not provide Python. Graphing and Python support are separate capabilities.
Is a graphing calculator automatically a CAS calculator?
No. Graphing and symbolic algebra are different capabilities. Many graphing calculators are non-CAS. If you need symbolic simplification, symbolic equation solving, symbolic differentiation, or symbolic integration, verify CAS capability for the exact model.
Does a bigger screen mean a calculator is a graphing calculator?
No. Scientific calculators can use multi-line or relatively detailed displays without providing on-device graphing. The defining distinction is the ability to plot mathematical graphs, not physical screen size alone.
Can a scientific calculator handle statistics?
Yes, depending on the model. Scientific calculators can provide substantial statistical functionality, including data calculations and regression on some models. If you need graphical statistical analysis such as on-device scatterplots, check whether graphing capability is required.
Is a graphing calculator necessary if I can use a graphing app?
Not always. For unrestricted homework, a scientific calculator plus a permitted graphing application may cover the required calculations and visualization. A handheld graphing calculator may still be necessary when a course specifically requires one or when external graphing software is unavailable or prohibited.
Which type is better for exams?
That depends on the exact exam. Calculator policies can distinguish among scientific calculators, graphing calculators, programmable models, and CAS-capable devices. Check the current rules from the exam administrator rather than choosing a category first and assuming it will be permitted.
Final Verdict
The defining practical difference between a scientific calculator and a graphing calculator is on-device graphing. A conventional scientific calculator handles mathematical calculations without plotting functions on its display, while a graphing calculator adds a graphical environment for plotting and investigating mathematical relationships. Function tables, statistics, matrices, equation solving, and even numerical calculus can appear on scientific calculators without changing that basic distinction.
Beyond graphing, the category names tell you surprisingly little about advanced capabilities. Numerical calculus, programming, Python, 3D graphing, and general CAS all depend on the exact model. If a course requires plots on the calculator, look at graphing models that meet its specific requirements. If symbolic mathematics is required, verify CAS separately. If neither on-device graphing nor symbolic manipulation is needed, an appropriately equipped scientific calculator may already provide the mathematical tools the work requires.