Best Graphing Calculator for Statistics: 9 Picks in 2026
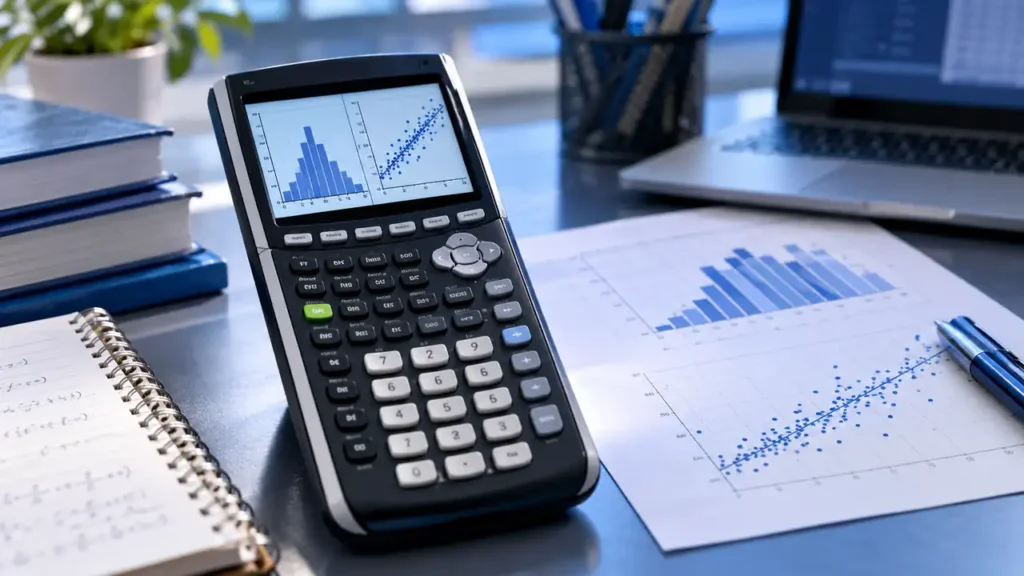
Statistics work often begins with a plain list of numbers and ends with a graph, regression line, probability model, or standard-deviation result. The calculator needs to move smoothly between those steps. A model that handles graphing beautifully but makes statistical lists awkward can slow down homework, while a low-cost scientific calculator may handle basic statistics without offering the visual analysis a course requires.
The most useful features for statistics include clearly supported standard-deviation and regression tools, data handling, graphing, readable notation, and a workflow that matches your course. The supplied product information does not describe every model’s exact statistical menus, so this guide avoids assuming capabilities that are not identified. The TI-84 Evo is the strongest overall fit here because its larger graphing area, icon-based home screen, simplified keypad, and stated performance improvements address the repeated graph-and-check workflow common in statistics.
Different buyers will reach different conclusions. A student on a tight budget may prefer a CATIGA model with explicitly listed standard deviation and linear regression. Someone working with probability distributions may favor the Casio fx-9750GIII, while a buyer who needs color-based visual separation may prefer the TI-84 Plus CE or Casio Prizm FX-CG50. A basic scientific calculator can still make sense for introductory statistical calculations, but it should not be mistaken for a graphing model.
Quick Answer
- Best Overall: TI-84 Evo Graphing Calculator for a clearer graphing workspace and streamlined navigation.
- Best for Listed Statistics Tools: CATIGA CS-121 for stated standard deviation, linear regression, and statistics functions at a lower cost.
- Best for Probability and Spreadsheets: Casio fx-9750GIII for listed probability distributions, spreadsheets, graphing, and MicroPython.
- Best Color and 3D Option: Casio Prizm FX-CG50 for color graphing, statistics, geometry, and listed 3D functions.
Best Graphing Calculator for Statistics Comparison Table
| Product | Best For | Statistics-Relevant Features | Display or Workflow |
|---|---|---|---|
| TI-84 Evo Graphing Calculator | Overall statistics coursework | Graphing workspace and streamlined tools | 50% more graphing space, icon-based home screen |
| TI-84 Plus CE | Color graphing and textbook-style input | Graphing, MathPrint, rechargeable battery | Vibrant color graphs |
| CATIGA CS-121 | Budget statistics features | Standard deviation and linear regression listed | Graph and formula shown together |
| CATIGA CS-229 | Compact graphing and statistics | Standard deviation and linear regression listed | Graph and formula shown together |
| TI-83 Plus | Traditional graph-and-table work | Graphing, matrices, split graph/table view | 64 x 96 pixel LCD |
| Casio fx-9750GIII | Probability and spreadsheet workflows | Probability distributions, spreadsheets, graphing | Natural Textbook Display |
| TI-84 Plus Silver Edition | Preloaded apps and graph-table analysis | Graphing, 21 apps, split graph/table view | USB file sharing |
| Casio Prizm FX-CG50 | Color and 3D visualization | Statistics, dynamic graphing, complex numbers | Color display and 3D functions |
| TI-30XIIS | Basic statistics without graphing | Statistics and conversions listed | Two-line display |
The reviews below separate full graphing calculators from the simpler statistics companion so the practical trade-offs remain clear.
1. TI-84 Evo Graphing Calculator Texas Instruments, White — Best Overall

Statistics students spend plenty of time checking how data behaves visually. The TI-84 Evo addresses that routine with a graphing area described as 50 percent larger than earlier space, giving plotted patterns and relationships more room on screen. That matters during a quick review of a scatterplot or function because cramped viewing can make a change in shape harder to inspect. The product information also describes a processor that delivers three times faster performance, although the supplied details do not define a specific benchmark.
The icon-based home screen places popular math tools near the front of the interface, while larger buttons and reduced keypad clutter aim to cut down on extra steps. Those features are practical for repeated statistical calculations, especially for a student moving between lists, formulas, and graphs during a study session. The white finish is cosmetic, so its recommendation rests on the shared TI-84 Evo design rather than appearance.
Pros
- 50 percent more graphing space is listed.
- Icon-based home screen places popular math tools prominently.
- Product information states three times faster performance.
- Larger buttons and a simplified keypad reduce visible clutter.
- Built for everyday classroom use according to the product description.
Cons
- The supplied information does not identify specific statistical functions such as regression or standard deviation.
- The listing does not clearly specify the battery system.
This model fits buyers who want a modern TI-84 workflow and a roomier graphing view for statistics. Choose a CATIGA model instead if explicitly listed standard deviation and linear regression matter more than interface updates. Choose the TI-84 Plus CE if color graphs and MathPrint are more useful to your coursework.
To buy this product, click here.
2. Texas Instruments TI-84 Plus CE Color Graphing Calculator, Black — Best for Color Graphing

The TI-84 Plus CE brings color into the graphing portion of statistics. Multiple plotted lines or visual elements can be easier to distinguish when they appear in different colors, which is useful during comparisons rather than a claim that color adds mathematical capability. Its MathPrint feature displays formulas, mathematical symbols, and stacked fractions in a textbook-like arrangement, giving students a more familiar view of expressions.
The listing identifies a rechargeable TI battery with runtime of up to one month per charge, presented as a stated capability rather than a guarantee. It also includes a four-year subscription for the online calculator. For a student moving between a physical calculator and browser-based work, that added access may be convenient, although the product information does not describe the online platform’s complete statistical feature set.
Pros
- Color graphing can help separate multiple plotted functions.
- MathPrint shows formulas and stacked fractions in textbook-style notation.
- The listing states a rechargeable battery with up to one month per charge.
- A four-year online calculator subscription is included.
- Supports graphing for math and science coursework through the listed education range.
Cons
- The supplied information does not identify specific regression, distribution, or standard-deviation menus.
- The online calculator’s complete statistics capabilities are not clearly described.
This is a sensible fit for statistics students who value colored plots and familiar mathematical notation. The TI-84 Evo offers a newer interface and larger stated graphing area, while the Casio fx-9750GIII gives clearer supplied evidence for probability distributions and spreadsheets. Check course expectations before deciding between those workflows.
To buy this product, click here.
3. CATIGA CS-121 Scientific Calculator with Graphic Functions — Best for Listed Statistics Tools

The CS-121 is one of the clearest matches for statistics based on the supplied feature list. It explicitly identifies statistics, standard deviation, and linear regression among more than 360 functions. That gives a buyer more concrete evidence than a general statement about advanced mathematics. The calculator also shows a graph and formula at the same time, a useful arrangement for checking whether an entered relationship matches the visual result.
Its compact body and included protective case suit students who carry a calculator between classes, although the product information does not establish how the housing performs over a particular period of use. The three listed modes cover angle measurement, calculation, and display, while the description also mentions fractions, complex numbers, and variable solving. Those tools broaden the model beyond basic data summaries, though the listing does not detail every statistical plot or probability option.
Pros
- Standard deviation is explicitly listed.
- Linear regression is explicitly listed.
- Graphs and formulas can appear together.
- More than 360 functions are identified in the product information.
- The listed dimensions are 7 by 3.3 inches, with a stated weight of 6.4 ounces.
Cons
- The listing does not clearly describe probability distributions or spreadsheet functions.
- The product information does not identify the full range of statistical graph types.
The CS-121 makes the most sense for buyers who want explicit statistics functions without moving into a larger or more expensive graphing ecosystem. A Casio fx-9750GIII may suit a probability-focused course better, while the TI models may be preferable where a particular classroom workflow is expected.
To buy this product, click here.
4. CATIGA CS-229 Scientific Calculator with Graphic Functions — Best Compact Alternative

The CS-229 covers much of the same statistical territory as the CS-121. Its supplied information lists standard deviation, linear regression, statistics, graph plotting, and simultaneous graph-and-formula viewing. For a buyer comparing the two CATIGA models, the meaningful distinction is limited in the available information. The CS-229 description places more emphasis on its smooth button layout, compact shape, and protective case.
That compact format can matter during long problem sets where a calculator needs to stay close without taking up much desk space. The product information gives the same 7 by 3.3-inch size and identifies more than 360 functions, including fractions, complex numbers, and variable solving. It does not specify the detailed statistical menus, graph types, or battery system, so buyers should avoid treating the long function count as proof of a particular course feature.
Pros
- Standard deviation and linear regression are listed.
- Supports plotting and graph analysis.
- Can display graphs and formulas together.
- More than 360 functions are identified.
- Includes a protective case according to the product information.
Cons
- The available information does not clearly distinguish its statistics workflow from the CATIGA CS-121.
- Probability distributions and statistical plot types are not clearly identified.
This model is worth considering when the listed CATIGA feature set matches your course and the specific listing is more convenient to obtain. The CS-121 is the cleaner pick if you want the same stated statistics capabilities with less ambiguity between the two descriptions. Buyers seeking a richer probability or spreadsheet workflow should look at Casio instead.
To buy this product, click here.
5. Texas Instruments TI-83 Plus Graphing Calculator — Best Traditional Graph-and-Table Workflow

The TI-83 Plus keeps the analysis centered on graphs and tables. Its split-screen function lets users trace a graph while scrolling through table values, a practical way to connect a visual curve with numerical output. Statistics students often need that connection while checking a model, and the feature is described directly in the supplied information rather than inferred from the model name.
The calculator also lists fourteen interactive zoom features and storage and analysis for up to ten matrices. Those capabilities may matter in broader math courses, although matrices are not a substitute for statistical functions such as regression or probability distributions. The renewed condition adds a buying variable, so the product’s condition and return terms deserve attention before purchase.
Pros
- Supports graph and table viewing on a split screen.
- Offers fourteen interactive zoom features.
- Can store and analyze up to ten matrices.
- Handles the calculus, engineering, trigonometric, and financial functions listed.
- Provides a familiar graphing-calculator format for buyers who prefer traditional controls.
Cons
- The supplied information does not specify regression, standard deviation, or probability functions.
- This listing is renewed, so condition details may require closer review.
The TI-83 Plus fits a buyer who values graph-table inspection and broader mathematical functions over a newer screen or explicitly listed statistics menus. The TI-84 models provide more current interface features in the supplied descriptions, while the CATIGA options state more direct statistics functions.
To buy this product, click here.
6. Casio fx-9750GIII Graphing Calculator, Python Programming, Black — Best for Probability and Spreadsheets

The fx-9750GIII has one of the strongest statistics-oriented feature descriptions in this group. The product information lists probability distributions, spreadsheets, graph plotting, and eActivities, giving it a useful spread for coursework that moves between data, formulas, and visual output. Natural Textbook Display shows expressions and results in textbook-style notation, which can make a long statistical expression easier to read than a plain linear entry.
MicroPython support adds a separate programming path. The listing says programs can be created on the calculator or transferred through a computer using USB, but MicroPython should not be treated as full desktop Python with every library or package. The black finish is cosmetic, and a pink listing of the same model should not be treated as a separate calculator recommendation.
Pros
- Probability distributions are explicitly listed.
- Spreadsheet functionality is explicitly listed.
- Supports graph plotting and eActivities.
- Includes MicroPython integration according to the product information.
- Natural Textbook Display presents expressions in textbook-style form.
Cons
- The supplied information does not identify specific regression or standard-deviation menus.
- MicroPython support does not establish compatibility with every desktop Python library.
This is a particularly sensible match for statistics students whose work includes probability distributions or spreadsheet-style organization. The CATIGA models provide clearer evidence for standard deviation and linear regression, while the TI-84 Plus CE may suit someone who values color graphs and MathPrint more heavily.
To buy this product, click here.
7. Texas Instruments TI-84 Plus Silver Edition Graphing Calculator — Best for Preloaded Apps

The TI-84 Plus Silver Edition provides a broad graphing workflow with 21 preloaded apps. The supplied information also identifies split-screen graph and table viewing, letting a student trace a visual relationship while checking corresponding values. That pairing is useful for statistics exercises that ask students to interpret a curve or compare numerical and graphical behavior.
USB On-The-Go technology supports file sharing with other calculators and connections to PCs according to the listing. USB connectivity should be understood as file sharing and computer connection here, not as proof of charging capability. The model handles the listed calculus, engineering, trigonometric, and financial functions, but its supplied description does not name specific statistics menus.
Pros
- Includes 21 preloaded apps.
- Supports split-screen graph and table viewing.
- USB On-The-Go supports listed file-sharing and PC connections.
- Handles the listed calculus, engineering, trigonometric, and financial functions.
- A one-year warranty is identified in the product information.
Cons
- Specific statistics functions such as standard deviation and regression are not identified in the supplied details.
- The listing does not clearly specify the battery system.
This calculator suits buyers who want a familiar TI graphing environment with apps already included. The TI-84 Evo is the stronger overall interface pick from the supplied information, while the Casio fx-9750GIII offers more directly stated probability and spreadsheet tools for statistics.
To buy this product, click here.
8. Casio Prizm FX-CG50 Color Graphing Calculator — Best for Color and 3D Visualization
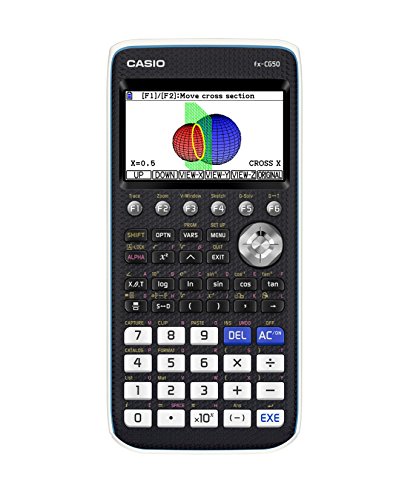
The Prizm FX-CG50 gives statistics buyers a visually rich alternative. Its supplied features include a color display, dynamic graphing, statistics, geometry, and graphing for complex, polar, and rectilinear equations. Color can help separate plotted elements during visual comparisons, while dynamic graphing can provide a way to inspect changing relationships. Those benefits concern presentation and exploration, not automatic improvement in statistical reasoning.
The calculator also supports up to three listed 3D functions, including spheres, cylinders, and planes. That capability reaches beyond the needs of many statistics courses, yet it may appeal to a student taking several math subjects at once. MicroPython integration is listed too, with the same practical limitation that a handheld MicroPython environment should not be assumed to support every desktop Python library.
Pros
- Color display supports visual separation of plotted elements.
- Statistics and dynamic graphing are explicitly listed.
- Supports up to three listed 3D functions.
- Natural Textbook Display shows expressions in textbook-style form.
- Includes MicroPython integration according to the product information.
Cons
- 3D graphing may be unnecessary for a statistics-only course.
- The supplied information does not identify specific regression or probability-distribution tools.
The FX-CG50 is a better fit for buyers who want statistics alongside color, geometry, and 3D visualization. For a focused statistics purchase, the CATIGA models provide more explicit evidence for standard deviation and linear regression, while the fx-9750GIII names probability distributions and spreadsheets.
To buy this product, click here.
9. TI-30XIIS Scientific Calculator — Best Basic Statistics Companion

The TI-30XIIS is the outlier in this roundup because it is a scientific calculator rather than a graphing calculator. It earns consideration only for buyers whose statistics work centers on basic calculations and who do not need plotted functions. The two-line display shows the entry and result together, while the supplied description identifies statistics, fractions, conversions, and scientific functions.
That simpler format can be less distracting for a short calculation, but it cannot replace a graphing model for visual data analysis based on the information provided. Solar and battery power are listed, and the product description includes an exam-approval claim. Policies can change, so current rules should be checked with the organization administering a particular exam rather than assumed from a product listing.
Pros
- Statistics functions are listed.
- Two-line display shows the input and result together.
- Supports fractions and conversions.
- Includes basic scientific and trigonometric functions.
- Solar and battery power are identified.
Cons
- It does not provide graphing capability based on the supplied product information.
- The two-line scientific format is limited for visual statistics and graph-based analysis.
Choose this model only if your course needs basic statistical calculations and explicitly permits a scientific calculator. A graphing model is the better match for regression visualization, plotted data, and graph-table analysis. Its inclusion here is a reminder that a low-cost statistics calculator is a different purchase from a graphing calculator.
To buy this product, click here.
Buying Guide
Start With the Statistical Tasks in Your Syllabus
Write down the operations your course actually requires before comparing screens and brands. Standard deviation and linear regression are explicitly listed for both CATIGA models, while probability distributions and spreadsheets are explicitly listed for the Casio fx-9750GIII. Those details carry more weight than a long general function count if your assignments repeatedly use one specific tool.
Separate Graphing From Basic Calculation
A two-line scientific calculator can handle entries and results, but it does not provide the graph-based workflow identified for the other models. If your class asks you to inspect plotted relationships, compare curves, or connect a table with a graph, choose a model with confirmed graphing capability. The TI-30XIIS belongs in a separate basic-calculation category.
Decide Whether Color Serves a Real Purpose
Color can help distinguish multiple plotted elements, as shown by the TI-84 Plus CE and Casio Prizm FX-CG50. It does not automatically provide stronger statistics functions. A monochrome model with explicitly listed probability or regression tools may be more useful than a color calculator for a course centered on data analysis.
Check the Difference Between Statistics and Programming
MicroPython on the Casio models creates a programming option, but it does not prove compatibility with every desktop Python package. Programming may be valuable for a specialized project, yet it should not outrank confirmed statistics features for ordinary coursework. Treat programming as an additional capability rather than evidence of a better statistics workflow.
Inspect the Display Workflow
Graph-and-table viewing can help connect numerical values with a visual relationship. The TI-83 Plus and TI-84 Plus Silver Edition identify split-screen graph and table features, while the CATIGA models describe viewing a graph and formula together. Those are different workflows, so compare them against the way your assignments present data.
Verify Course and Exam Policies Separately
A calculator’s functions do not establish permission for every test. The supplied listings include exam-related claims for some products, but current policies can change and may vary by organization or exact model. Confirm the current rules with your instructor or the administering organization before relying on a calculator for an exam.
Best Graphing Calculator for Statistics FAQ
What Is the Best Graphing Calculator for Statistics?
The TI-84 Evo is the strongest overall pick in this group because the supplied information identifies a larger graphing area, an icon-based home screen, larger buttons, and stated performance improvements. Its listing does not specify every statistics function, so buyers who need confirmed standard deviation and linear regression may prefer the CATIGA CS-121.
Which Calculator Lists Standard Deviation and Linear Regression?
The CATIGA CS-121 and CS-229 listings explicitly include standard deviation and linear regression. The available information does not describe every menu or statistical plot, so course requirements should still be checked before purchase.
Which Calculator Is Best for Probability Distributions?
The Casio fx-9750GIII is the clearest match because probability distributions are explicitly listed. It also lists spreadsheets, graph plotting, and Natural Textbook Display, which may help with a broader statistics workflow.
Is a Color Calculator Better for Statistics?
Color can make multiple plotted elements easier to distinguish, which may help during visual comparisons. It does not automatically provide better statistical calculations. The TI-84 Plus CE and Casio Prizm FX-CG50 list color-related display features, while other models may offer more directly stated statistics tools.
Can a TI-30XIIS Replace a Graphing Calculator for Statistics?
No. The TI-30XIIS is useful for basic statistical and scientific calculations, but the supplied information does not identify graphing capability. It cannot replace a graphing model for plotted data, graph-table analysis, or visual regression work.
Does Python Matter for a Statistics Calculator?
Python can matter for programming projects, but it is separate from built-in statistics functions. The Casio fx-9750GIII and Prizm FX-CG50 list MicroPython integration. That support should not be treated as access to every desktop Python package or library.
Should I Buy a TI-84 or Casio for Statistics?
The choice depends on the confirmed tools you need. TI models in this guide emphasize graphing, graph-table viewing, color, apps, or interface features. The Casio fx-9750GIII provides explicit probability distributions and spreadsheets, while the Prizm FX-CG50 emphasizes color, dynamic graphing, and 3D functions.
Are Calculator Listings Enough to Confirm Exam Eligibility?
No. Product capability and official exam eligibility are separate questions. Check the current policy for the exact model with the organization administering the exam, since seller or listing claims may not reflect current rules.
Final Verdict
The TI-84 Evo is the best overall fit for statistics buyers who want a modern graphing workflow, a larger stated graphing area, and simplified access to common tools. It is the most balanced recommendation in this group, although its supplied description does not name specific regression, standard-deviation, or probability menus. That gap matters for buyers who need a confirmed statistical function rather than a general graphing platform.
For explicit listed statistics capabilities, the CATIGA CS-121 is the more direct budget-oriented alternative, with standard deviation and linear regression identified. The Casio fx-9750GIII is better suited to probability distributions and spreadsheet work, while the TI-84 Plus CE and Casio Prizm FX-CG50 serve buyers who value color visualization. The TI-30XIIS remains a basic scientific companion, not a substitute for a graphing calculator. Match the final choice to the exact operations, display workflow, and policy requirements in your course.